
The May 2019 HiveEx Report is out now! Click to View
The big money problem on cryptocurrency exchanges
While trading on cryptocurrency exchanges is great for the average crypto trader, it’s not always a viable option when looking to trade large amounts. While you might hear about people making big money on bitcoin or Ethereum, the truth is that compared to normal forex markets, the volume being traded is still very little. This is especially true in Australia. As a result, even trying to buy around AU$50,000 at once can result in the market price moving, and the buyer paying more for coins as the order moves down the book.
Exchanges also aren’t geared up to facilitate such big trades, and as a result can be quite restrictive to large customers. For instance, some exchanges cap their maximum daily trade limit to $10,000 or $50,000 per day.
Some of these restrictions that impact the amount that can be bought, sold or withdrawn include:
- Transaction methods
- Verification levels
- How long a customer has been trading on the platform
- The exclusivity of the platform
Because of these limitations, those looking to purchase a high volume of cryptocurrency would need to make several smaller transactions over a period of time until they’ve purchased the amount they want.
Over-the-counter (OTC) trading platforms such as HiveEx.com are able to solve this issue, by accessing funds through liquidity providers who individually hold large amounts of cryptocurrency and process large transactions outside of exchanges.
OTCs provide customers with a quote for one upfront fixed price for the entire amount that you would like to buy or sell, avoiding the price slippage you would face on an exchange. It’s also done in one transaction as opposed to multiple smaller transactions.
This report outlines the growth of the cryptocurrency market and the need for OTC services to bridge the gap for the ever-growing demand of high volume trades. The issues this market faces are increasing and the impact is greater, as more people all over the world jump on the cryptocurrency wagon. But opportunities to improve the way we do banking is the most exciting part of this new era of fintech, and it has only just begun.
Part 1
The gap in the market
Billions of dollars are being bought and sold on cryptocurrency exchanges every day. Many of these trades are very high value and can take up to thousands of smaller transactions to be processed. Let’s take a look at bitcoin (BTC) for instance, as despite more than 1,500 cryptocurrencies in existence, bitcoin holds the biggest market share of approximately 43.72% on 20 March, 2018. (1)
According to BitInfoCharts, the average trade value of BTC on March 20, 2018 was US$49,258 (AU$63,996.04). However, the median trade value of bitcoin – the middle value when values are arranged in ascending order – was only US$645.29 (AU$838.63). This means that half of all bitcoin trades fell below US$645.29 (AU$838.63), while the other 50% of transactions fell above US$645.29 (AU$838.63).
The image below puts this into perspective. It shows the value of trades that are taking place outside of those made by the average bitcoin trader.
(1) Bitcoin market share was calculated by dividing bitcoin’s market capitalisation (US$152,018,618,298) by total market capitalisation (US$347,682,802,332) as at March 20, 2018 according to CoinMarketCap.
The Spread of Bitcoin Trades as at March 20, 2018
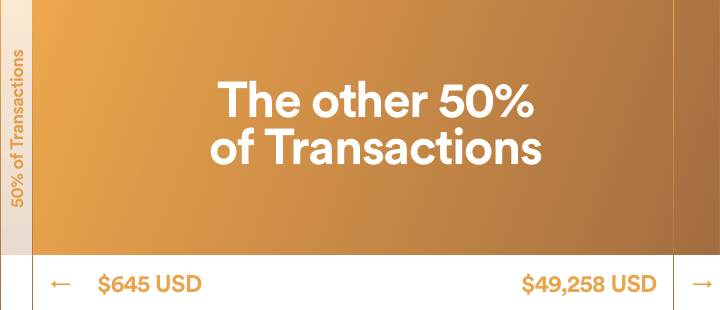
The fact that the average trade value is US$49,258 (AU$64,131) while 50% of trades fall below US$645.29 (AU$838.63) means that higher value trades are pulling the average up.
For context, the size of the largest trades according to Blockchain.info’s list of Largest Transactions ranged from 2.13 BTC (US$19,125.27/AU$24,905.08) to 581.78 BTC (US$5,223,802.62/AU$6,802,745.30) on March 21, 2018. One of the largest trades on Blockchain.info, of 339.85 BTC, required 2,383 individual transactions to process.
There are currently 190 exchanges catering for the average trader according to CryptoCoinCharts as at March 20, 2018. But what about those who want to trade millions of dollars in cryptocurrency at a time? You shouldn’t have to make loads of smaller transactions or face the onslaught of slippage from such small total volume across the exchange. This is where OTC trading desks, such as HiveEx.com, step in.
How much does it cost to do a large trade on an exchange versus OTC?
High volume traders are potentially wasting thousands of dollars every day by trading high volumes on exchanges. We performed a comparison between the highest volume Australian cryptocurrency exchange BTC Markets and OTC service HiveEx.com to see just how much money could be spilling down the drain.
The scenario we chose was to buy AU$400,000 worth of BTC on the two different platforms. It was increased to AU$407,400.62 to fit available trade limits on BTC Markets’ Sell Orderbook.
On BTC Markets, it took 46 individual transactions (2) to trade this figure. It also charges a 0.23% fee for trading between AU$400,000.01 and AU$650,000. This returned 34.31 BTC after fees are deducted. HiveEx.com would take one transaction and return 35.03 BTC and this value is inclusive of any HiveEx.com trading fees. This 0.72 BTC difference between the two providers is worth AU$8,404.34 (US$6,464.88).
(2) In this scenario it took 46 transactions but this can vary depending on available trade orders.
Part 2
The growth of the cryptocurrency market
The number of cryptocurrencies and exchange platforms are increasing each year. Currently, there are 190 exchanges, compared to 70 exchanges three years ago, on 15 March, 2015.Demand to buy and sell is also growing as the number of cryptocurrencies and trading platforms increase.
There are currently 1,568 different cryptocurrencies available, as at 21 March, 2018. This breaks down to 654 tokens and 914 coins. It all started with bitcoin, which was first released on January 9, 2009, and various versions launched in the following years. The first experiments in altcoins started happening in 2011 with Namecoin, iXcoin, SolidCoin and others being developed and released. Litecoin followed soon after in the same year.
From December 2013 to the end of 2017, the number of cryptocurrencies increased from 40 to 1,273 – a 3,083% increase. The graph below shows the extreme growth in the number of cryptocurrencies from 2013.
Number of cryptocurrencies available since June 2013
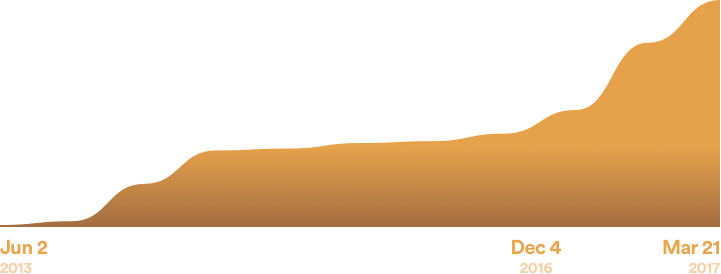
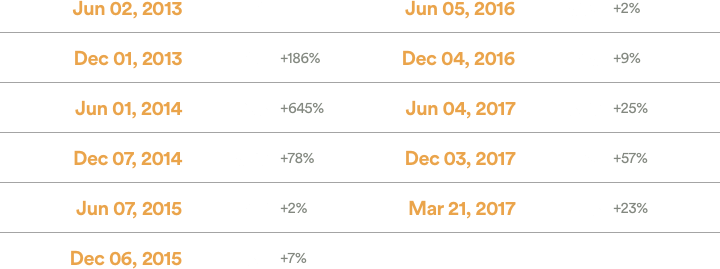
The table below shows the number of cryptocurrencies in circulation at June and December each year since June 2013 (3), and the current number in March 2018. It also shows the largest six-monthly growth was in June 2014, with 645% more coins than in December 2013. Growth began to pick up again in 2017 when it really started to boom, with 1,568 cryptocurrencies recorded in March 2018.
(3) Data available from CoinMarketCap starts from 2013.
Number of cryptocurrencies available since June 2013
Growing number of cryptocurrency transactions
The number of transactions on the blockchain have dramatically increased over time. In fact, only in 2011 did bitcoin make a visible appearance on the charts, hitting 13,900 transactions on June 14 that year, according to BitInfoCharts. Transactions then declined until May 2012 when it officially began its upward trajectory.
On August 8, 2015, Ethereum also made its way onto the map, recording 2,881 transactions, has been growing in popularity ever since.
June 12, 2017 saw Ethereum finally overtake bitcoin in terms of total transactions made in one day, with a recorded 292,941, compared to bitcoin’s 268,951 transactions. Bitcoin hasn’t re-claimed the transactional throne since, however it still dominates its market capitalization and total volume traded per day.
On December 14, 2017, bitcoin hit its peak, with 490,459 transactions recorded on the blockchain. Ethereum’s peak came soon after on January 4, 2018 with a total of 1.35 million transactions recorded.
Q1 2018 saw the peak period decline for both currencies. On March 20, 2018, Ethereum recorded a total of 661,791 transactions. Despite dropping since it’s peak, this is still an increase of +22,870.9% when compared to its first appearance on the charts in August 2015. Similarly, bitcoin clocked in at 195,041 on March 20, 2018, an increase of 1,303.2% since first appearing on the charts in June 2011.
Despite the current drop in transactions for bitcoin and Ethereum, the cumulative total of all blockchain transactions – not limited to cryptocurrency – has been steadily on the rise with no signs of slowing down. As at March 19, 2018, there were over 305.61 million transactions recorded in a single day, according to Blockchain.info. This is an increase of 48.27% when compared to the 206.12 million transactions that occurred a year ago on March 18, 2017.
Total number of blockchain transactions
Part 3
The rise of cryptocurrency value
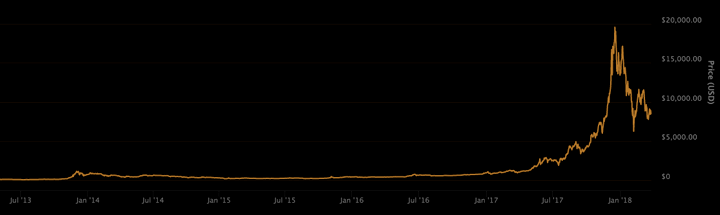
As the value of the coins rise, it’s no surprise that bitcoin’s popularity – and other cryptocurrencies’ – are increasing. The increase in value causes higher demand and in turn, the value continues to increase. Take bitcoin for example, which saw 958.32% growth from January to December 2017. Despite its fall from the December peak to the current $8979 per BTC on March 21, demand still continues and billions of dollars in trades occur daily.
Price of bitcoin historically
Bitcoin and Ethereum: Average trade values
Since cryptocurrency first launched in 2009 with bitcoin, average trade values – the average of all cryptocurrency trades processed per day – of all cryptocurrencies have rapidly grown over a period defined by high volatility. The two biggest cryptocurrencies on the market, bitcoin and Ethereum, have fluctuated in average trade value with steady growth over a seven-year period since Ethereum entered the market.
According to Bitinfocharts, on 1 January, 2011 the average trade value for bitcoin was recorded at US$24.82 (AU$32.25). Five years later on January 2, 2016, this amount had increased exponentially to US$3,010 (AU$3,912). By November 5, 2017, it peaked at US$180,441 (AU$234,534) – that’s an increase of +726,898% (4) since January 2011 to its peak in November.
Although Ethereum has made similar waves in trade values, it has not hit the same highs as bitcoin. On January 24, 2016, bitcoin hit its first major hike when its average trade value reached US$132,628 (AU$172,330). Comparatively, on this same day Ethereum sat at US$321.54 (AU$417.88), representing a difference in value of US$132,307 (AU$171,949).
Ethereum reached its first hike in trade value on June 12, 2017, when Ethereum reached US$32,847 (AU$42,679), eclipsing bitcoin’s US$30,093 (AU$39,101). Over the period of January to September 2017, bitcoin and Ethereum both reached similar value highs. Though by November 2017, competition between the currencies had settled and bitcoin soon out-reached Ethereum. On November 5, 2017, bitcoin’s average trade value hit US$180,441 (AU$234,472), while Ethereum sunk to US$5,669 (AU$7,367).
While both currencies continue to fluctuate in average trade value, steady growth over the past seven years – and particularly over the past 6 months – demonstrate that average trade value for all cryptocurrencies is on the rise. This simultaneously highlights the need for high limit exchanges.
(4) This was calculated by dividing the difference in bitcoin trade value from November 5, 2017 (US$180, 441) to January 11, 2011(US$24.82) by the bitcoin trade value as at January 11, 2011 (US$24.82). This figure was then multiplied by 100 to yield a percentage increase of 726,898%.
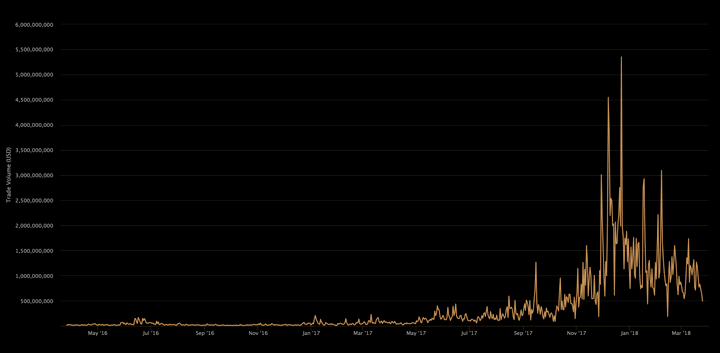
Value of exchange trade volume
The value of trading volume on major blockchain exchanges has grown exponentially over the past two years. This metric equates to the amount of cryptocurrency coins traded within a 24-hour period and is therefore crucial to understanding the state of the market.
According to blockchain.info, on March 22, 2016, the amount of cryptocurrency traded on major blockchain exchanges was US$21.4 million (AU$27.8 million). This value hit an all-time high nine months later when on December 22, 2017 trading volume peaked at US$5.4 billion (AU$6.95 billion). This represents an increase of +24,949.62% (5) over the nine-month period.
On December 23, 2017, a fall in price to US$1.97 billion (AU$2.56 billion) initiated a correction in the market, though the amount traded has since levelled to range between US$188.5 million (AU$245.04 million) and US$3.1 billion (AU$4.02 bilion). While the value of exchange trade volume remains volatile, gradual growth over the past two years demonstrates the market shows no signs of slowing down.
(5) This was calculated by dividing the difference in exchange trade value between March 22, 2016 (US$21.4 million) and December 22, 2017 (US$5.4 billion) by the exchange trade volume as at March 22, 2016 (US$21.4 million). This figure was then multiplied by 100 to yield a percentage increase of 24,949.62%.
USD exchange trade volume
Part 4
And it’s just the beginning
With the growing number of exchanges, currencies and transactions, the growth in the cryptocurrency market creates a newfound gap – the need for OTC trading platforms for high trade volumes. By accessing funds through liquidity providers and processing large transactions outside of exchanges, OTC platforms such as HiveEx.com reduce the barriers to entry and fill this market need.
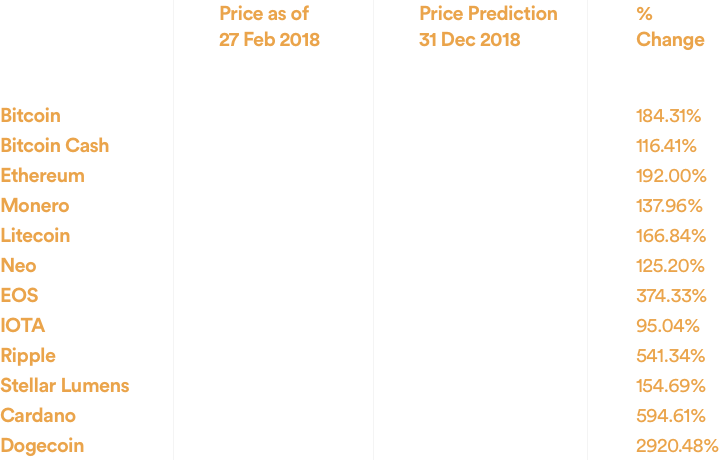
The market growth does not appear to be slowing down anytime soon, either. In March 2018, finder.com asked fintech leaders from across the globe for their forecasts on the top 10 cryptocurrencies by market capitalisation, as well as the top two trending coins, compiling the results in a monthly Cryptocurrency Predictions Report.
The panelists predicted positive price growth by the year’s end for all 12 coins – the first time this has occurred since the report began in January 2018. In fact, the greatest predicted price increase was +2,920.48%, for Dogecoin. With value increases of this scale, demand will likely follow.
It is a similar story for market capitalisation, with bitcoin (+194%), Bitcoin Cash (+123%) and Ethereum (+212%) each predicted to experience positive growth by the end of 2018, which could provide an insight into what’s to come.
Cryptocurrency average price predictions (in USD)
Disclaimer:
This information should not be interpreted as an endorsement of cryptocurrency or any specific provider, service or offering. It is not a recommendation to trade. Cryptocurrencies and ICOs are speculative, complex and involve significant risks – they are highly volatile and sensitive to secondary activity. Performance is unpredictable and past performance is no guarantee of future performance. Consider your own circumstances, and obtain your own independent legal, tax and accounting advice, before relying on this information. You should also verify the nature of any product or service (including its legal status and relevant regulatory requirements) and consult the relevant Regulators’ websites before making any decision.